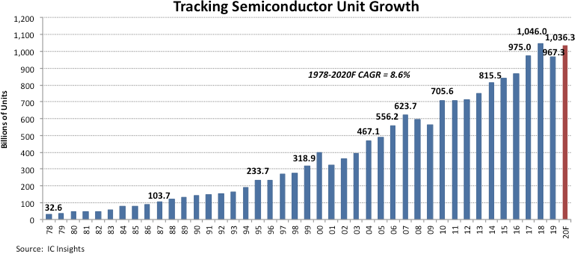

The 7% increase to 1,036.3 billion total semiconductor shipments expected in 2020 follows an 8% decline in 2019 and 7% growth in 2018, the year that semiconductor shipments reached 1,046.0 billion units—a record high that is expected to remain in place through at least this year (Figure 1).
Starting with 32.6 billion units in 1978 and ending in 2020, the CAGR for semiconductor units is forecast to be 8.6% over 42 years.

From 2004-2007, semiconductor shipments broke through the 400-, 500-, and 600-billion unit levels before the global financial meltdown led to a steep decline in semiconductor shipments in 2008 and 2009. Unit growth rebounded sharply in 2010 with a 25% increase and surpassed 700 billion devices that year.
Another strong increase in 2017 (12% growth) lifted semiconductor unit shipments beyond the 900-billion level before the one trillion mark was surpassed in 2018.
The 25% increase in 2010 was the second-highest growth rate across the time 42-year time span. The largest annual increase in semiconductor unit growth was 34% in 1984, and the biggest decline was 19% in 2001 following the dot-com bust.
The global financial meltdown and ensuing recession caused semiconductor shipments to fall in both 2008 and 2009; the only time there have been consecutive years of unit shipment declines.
By a greater than 2:1 margin, the percentage split of total semiconductor shipments is forecast to remain weighted toward O-S-D devices in 2020 (Figure 2).
O-S-D devices are forecast to account for 69% of total semiconductor units compared to 31% for ICs. This percentage split has remained fairly steady over the years.
Many of the semiconductor categories forecast to have the strongest unit growth rates in 2020 are those that are essential building blocks for smartphones, automotive electronics systems, and devices that are essential in computing systems used in artificial intelligence, cloud and “big data” systems, and deep learning applications.

FROM:electronicsweekly